Coastal conservation incorporating NbS < Subjects
Analysis and evaluation of the impact of climate change on coastal areas, including waves

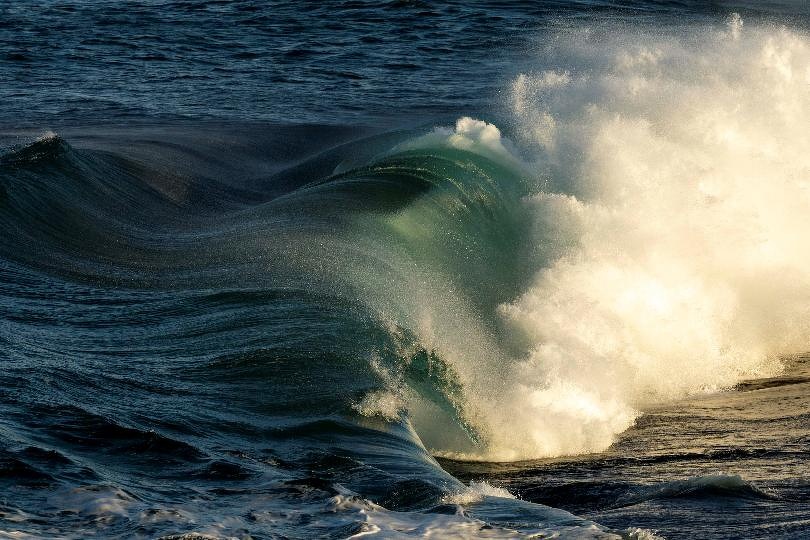
Photo: Ocean Image Bank Thomas Horig
Materials and Methods
Analysis of External Forcing Factors Using Literature Review and ERA5
A literature review was conducted to identify and organize past flooding cases for Majuro Atoll, and the external forcing factors were analyzed using global wave reanalysis data (ERA5).
Analysis of Wave Characteristics Based on Field Observations
Two field observations and surveys (November 2024 and February 2025) were conducted with the primary objective of gaining a more detailed understanding of the spatiotemporal characteristics of waves and the status of coastal protection. To understand the wave characteristics along the atoll coast, during the first expedition, hydraulic wave height meters were installed at two points: on the open-ocean reef and on the western side of the atoll, and wave observations were conducted for approximately two months.
Wave Model Reproduction
Based on the knowledge gained from global reanalysis data and field observations, a wave model reproduction calculation was conducted to obtain a detailed understanding of the wave characteristics of Majuro Atoll. Because Majuro Atoll is shielded by Arno Atoll to the east, a wide area including both atolls was designated the first computational domain, and calculations were performed using the third-generation wave model (SWAN) under wave boundary conditions and wind input conditions based on global reanalysis data. Furthermore, by nesting the results of the first computational domain, the wave characteristics within the second computational domain (white square in Figure 2), set around Majuro Atoll, were reproduced with a finer computational mesh (approximately 100 m).
Interim Results
Results of Literature Survey and Analysis of External Forcing Factors Using ERA5
The literature survey revealed that flooding occurs on Majuro Atoll approximately once every few years, and that these causes can be divided into tropical cyclones and typhoons and the onset of distant swells. Flooding has been frequently reported in the DUD area on the eastern side of the atoll and on small islands in the southern part of the atoll. Flooding has also been reported from the atoll side, as well as from the open ocean side, where wave heights are higher. Long-term data (hourly data from 2010-2023) from a calculation point near Majuro Atoll was analyzed using global wave reanalysis data (ERA5) and a global tidal model (TPXO). The high wave season in this area is from November to March, with northeasterly waves predominating due to the influence of trade winds. Significant wave heights are only around 3 m at their highest, but it is believed that inundation of coastal lowlands occurs when these heights coincide with high tide. Based on hourly data from 2010-2023, a plot of the wave inundation index (the square root of the product of wave height and wavelength) against tide level confirmed that inundation occurs when high waves coincide with high tide. It was found that these complex factors are responsible for the inundation events.
Analysis of Wave Characteristics Based on Field Observations
We analyzed time-series changes in mean and maximum water depths derived from 15-minute-per-hour water depth data measured at the reef shoreline, as well as time variations in significant wave height and its short-period components (periods less than 25 s) and long-period components (periods greater than 25 s).
The mean reef water depth was less than 1 m even at high tide, and wave heights fluctuated similarly to tide level due to saturation with respect to water depth through wave breaking. However, significant long-period fluctuations occurred on the reef because some of the energy of incident waves was transferred to long-period components through nonlinear interference. Generally, under extreme wave conditions, long-period components developed significantly on the reef, causing significant flooding due to short-period waves riding on the crests of long-period waves.
Figure: Wave observation and flood monitoring results
The photo on the upper right shows a solar camera installed on a school building (St. 1) located on the coast to monitor flooding. At this location, 30-second images of the seaward side were captured every hour during the day to monitor wave overtopping of the dikes installed on the coast. The photo on the lower right shows a frame from the image, which shows the many upright dikes in this area. During the monitoring period, minor wave overtopping, as shown in the photo, was captured. However, no incidents that would have led to significant flooding in the hinterland were observed, confirming that the structure was functioning.
Wave Model Reproduction Results
The figure below shows the annual mean significant wave height around the atoll, calculated from the 2023 calculation results. Wave heights are higher on the northeastern side of the atoll, corresponding to the prevailing wave direction. The average wave height offshore the reef is approximately 1.5 m, while the average wave height on the southern side is below 1.0 m. Within the atoll, northeasterly winds tend to increase wave heights overall on the west side. However, swells propagating into the atoll from the northern reef opening create a wave height distribution running east-west within the atoll. Because the results shown here are for a single year, we plan to clarify the statistical properties of inundation hazards and sediment transport external forces through long-term reproduction calculations of past data.
Figure: Reproduction calculation results using a wave model


